EasyStat
Believe it or not Statistics can be easy! EasyStat makes it that way. With a few clicks and data entries all of your statistics problems can be solved in an instant. It is powerful, compact, easy to understand and practical. Ninety nine (99)% of the basic statistics are packed into a power pack of stat calculations.
With EasyStat you can perform forecasting based on sales history using linear estimation. EasyStat computes all basic statistics including mean, weighted mean, sample standard deviation, population standard deviation, correlation, combinations, permutations, probability and others. Users can perform predictions over ranges of input to model sales, production and other business processes. It is a must have for school studies, a student can in seconds calculate outputs for lab studies and other statistical problem assignments. Give yourself the advantage at school with this simple powerful tool.
EasyStat covers Probability and Probability Distributions, Frequency Distributions, Data Sorting and Median, Confidence testing and more. It also contains a powerful built in scientific calculator and extensive equation library.
Powerful. Easy to Use. Practical. Designed for real world applications. It is a must for your desktop. Buy it now, don’t wait. Believe it or not statistics can be easy with EasyStat!
Privacy Statement
The Information We Collect:
This notice applies to all information input into this app. The information input is used to support the user requested calculations locally within this application only.
The Way We Use Information:
We use the information you provide to perform calculations within the application. We do not share this information; this information is only used with the app to perform calculations.
Features:
- Computes all basic statistics
- Save and retrieve study case data in over 200 study cases
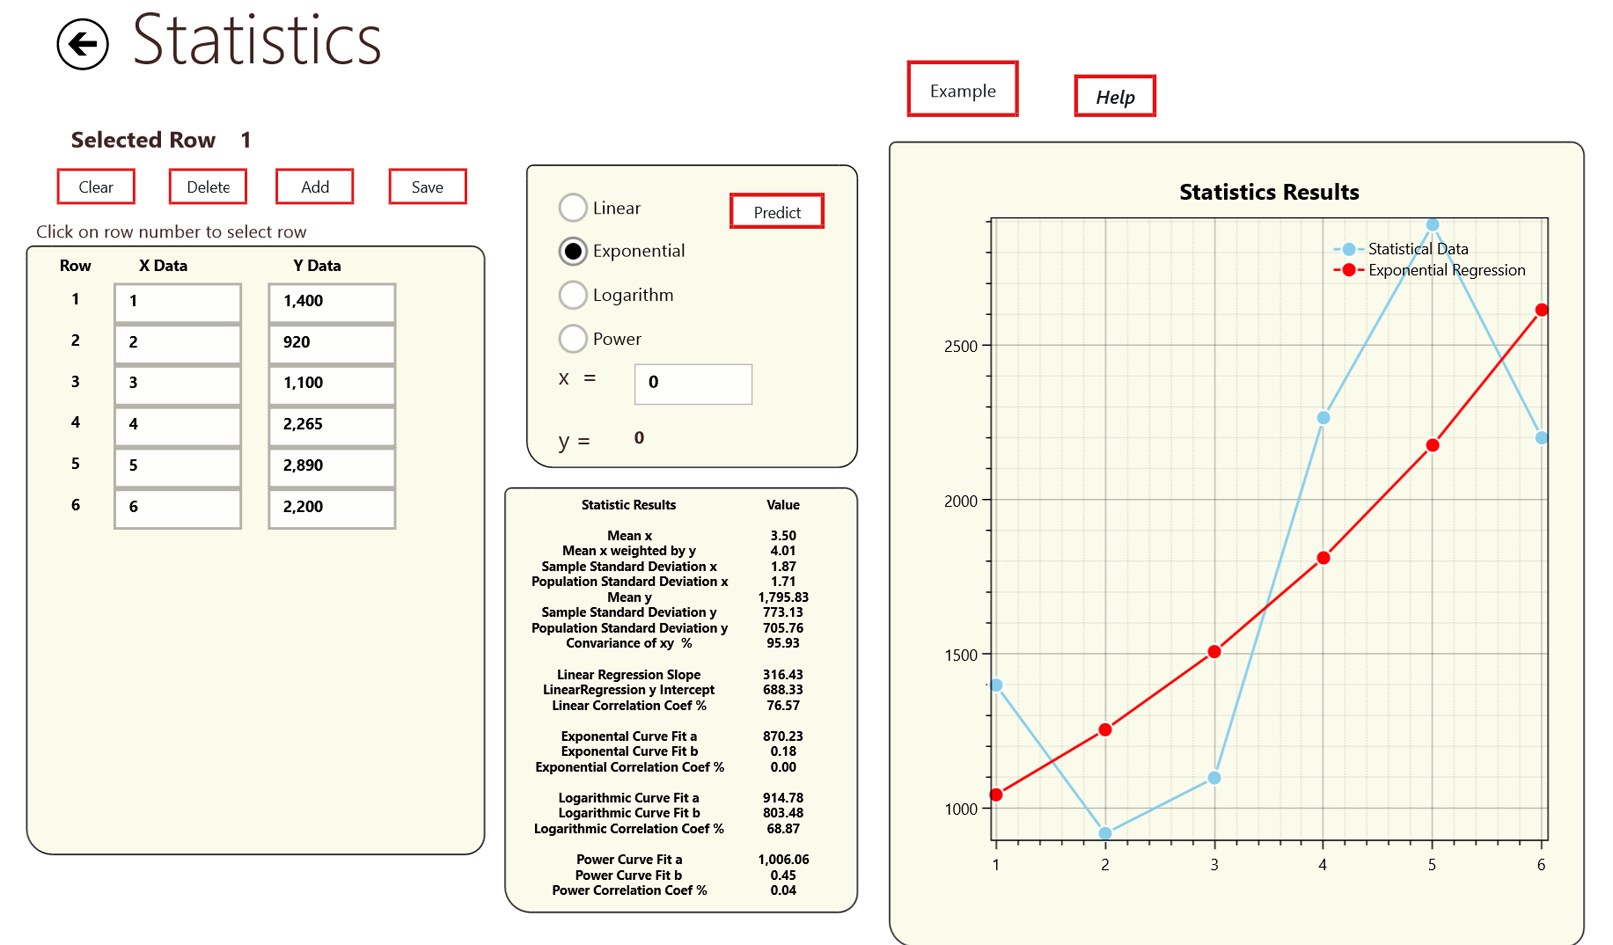
- Four types of regression – Linear , Exponential , Logarithmic , and Power
- Easy to use data editor
- Predict statistics based on regression models
- Graphical display of data and regressions
- Bayes Theorem
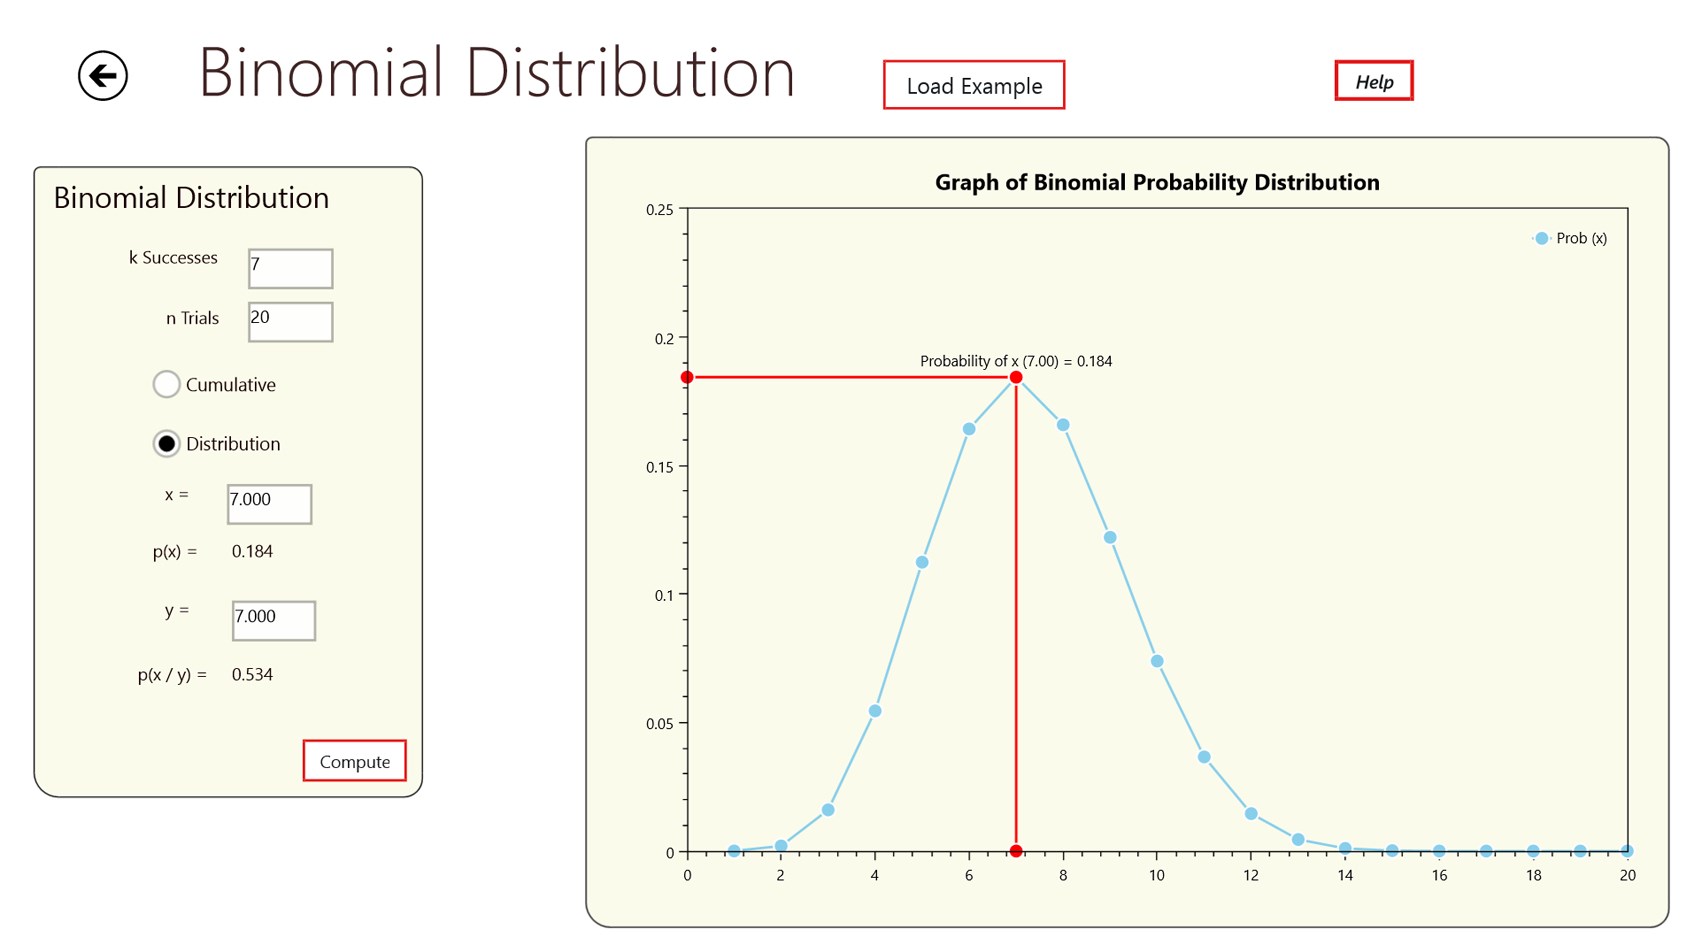
- Probability – Combinations , Permutations and Binomial Probability Distributions
- Poisson Distribution Application
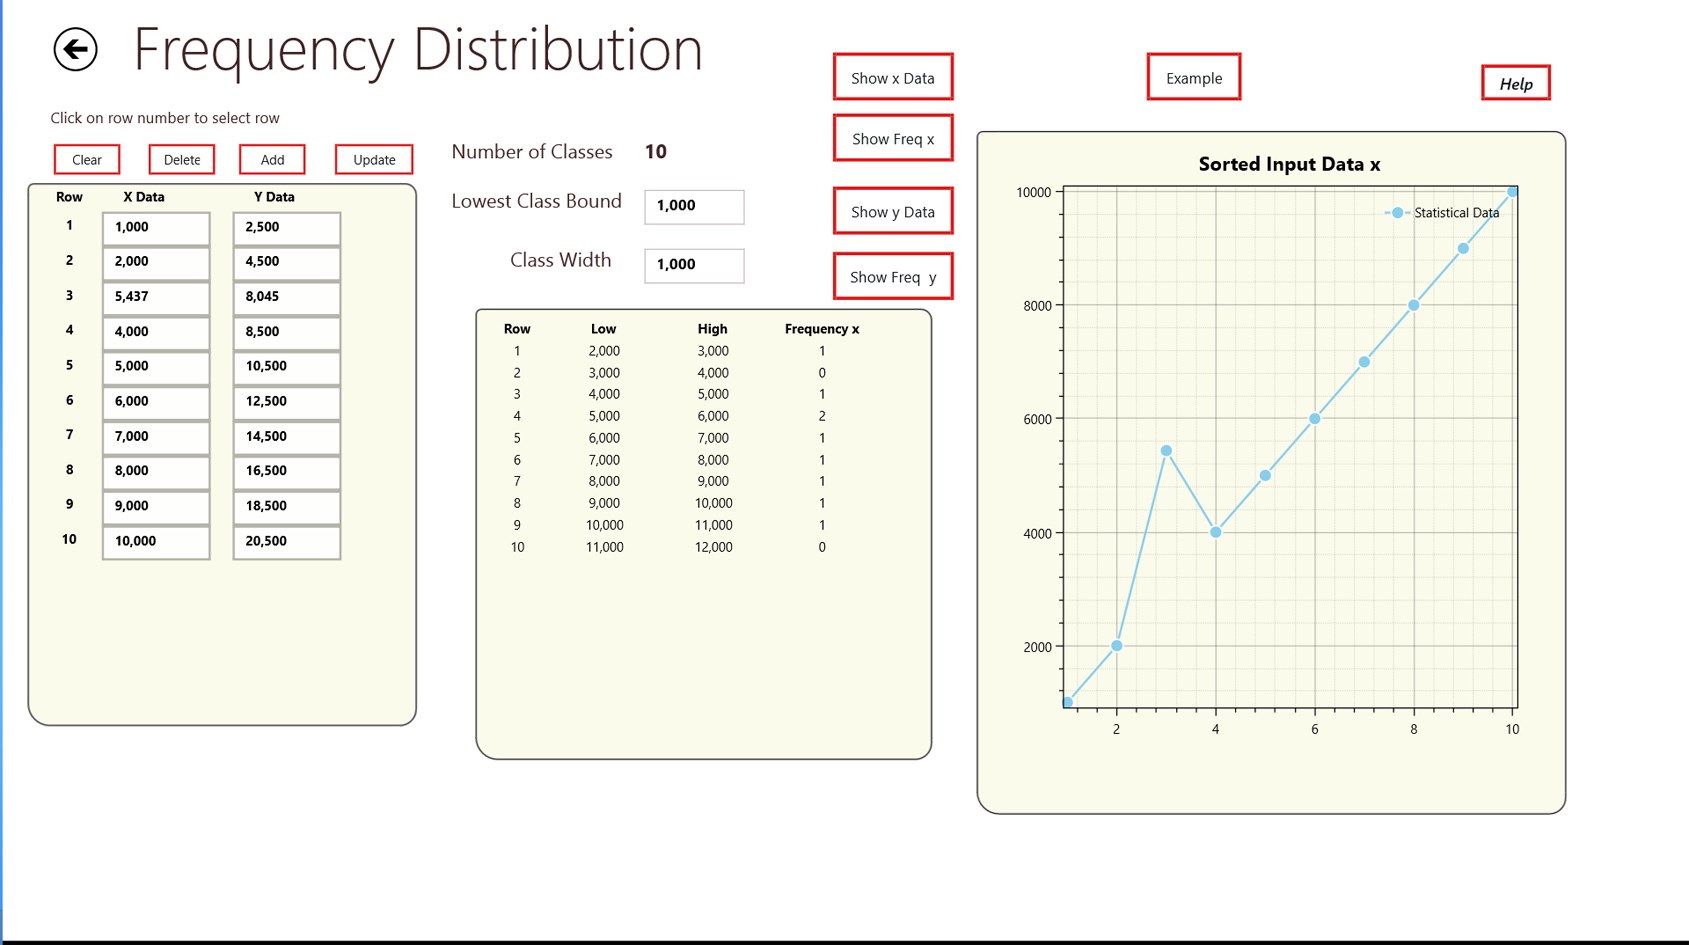
- Frequency Distribution Models and Graphical Results
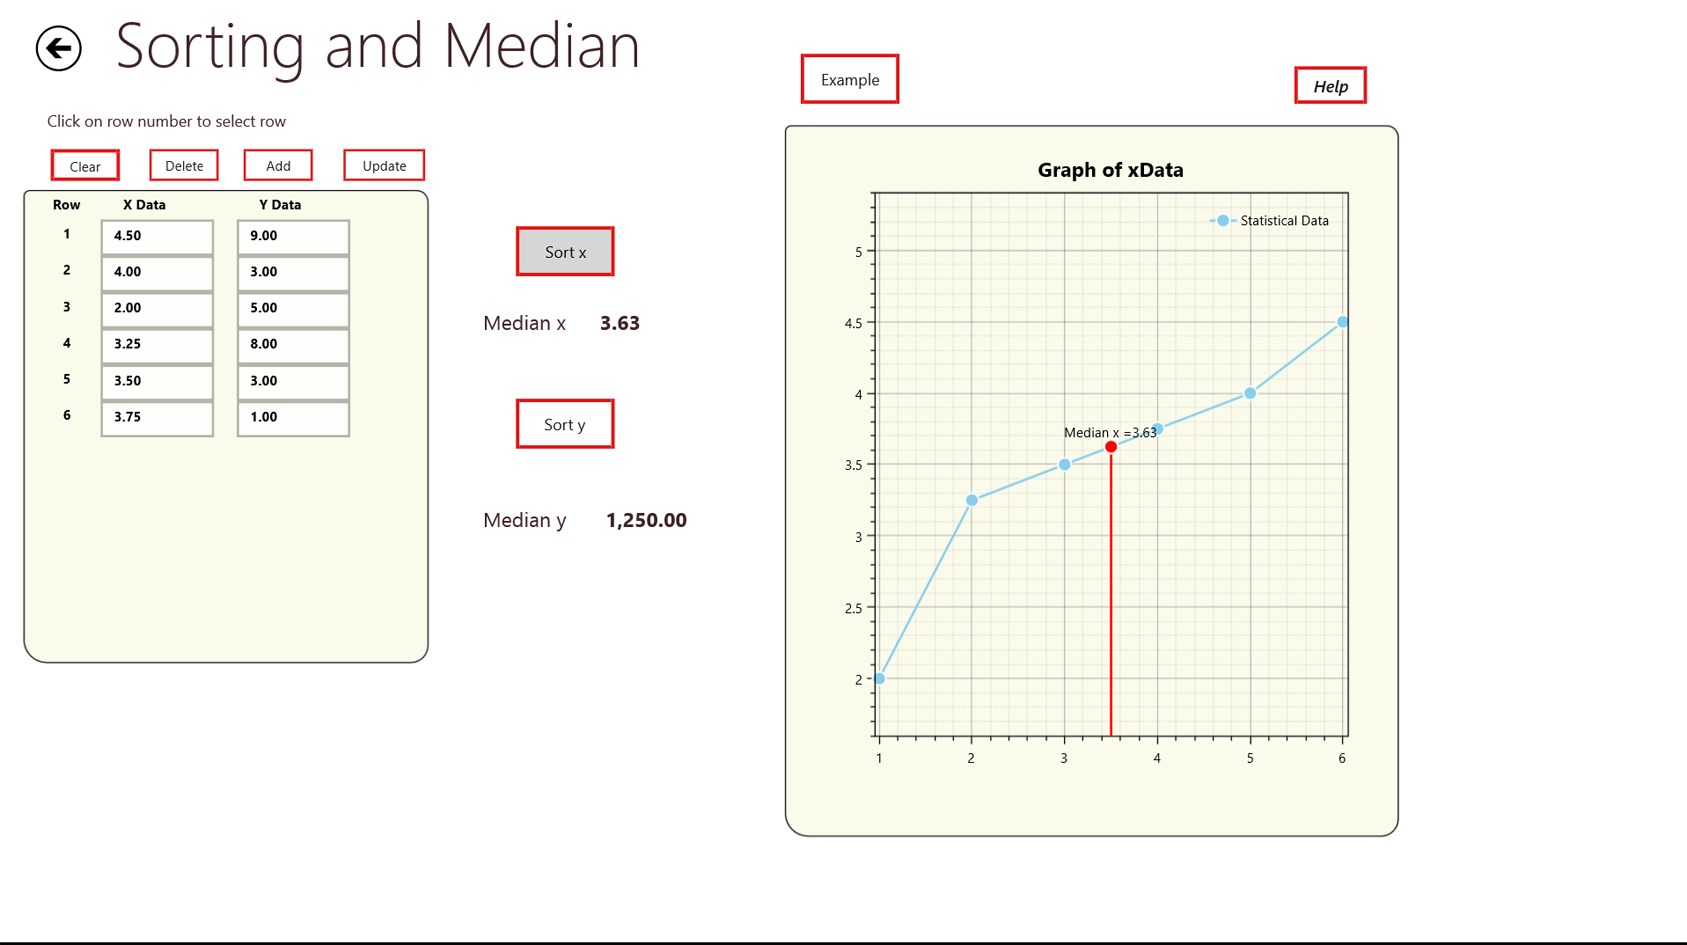
- Data Sorting and computation of median with graphical results
- Confidence testing on data streams and Graphical Results
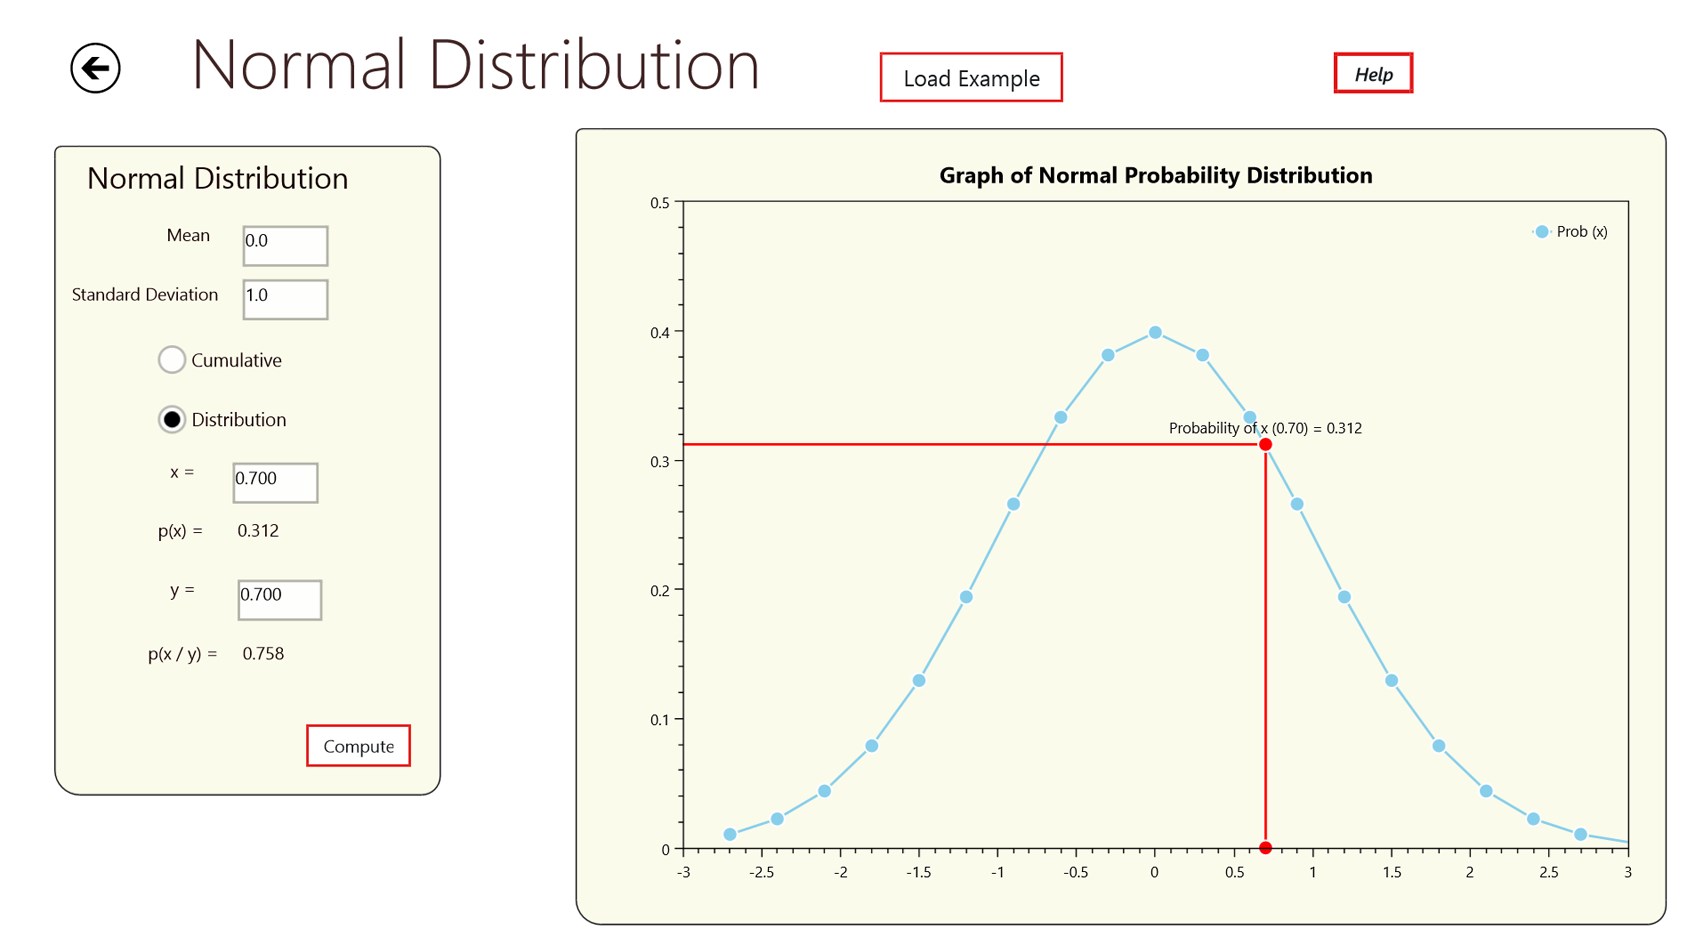
- Graphical Display and Modeling of six different probability distributions
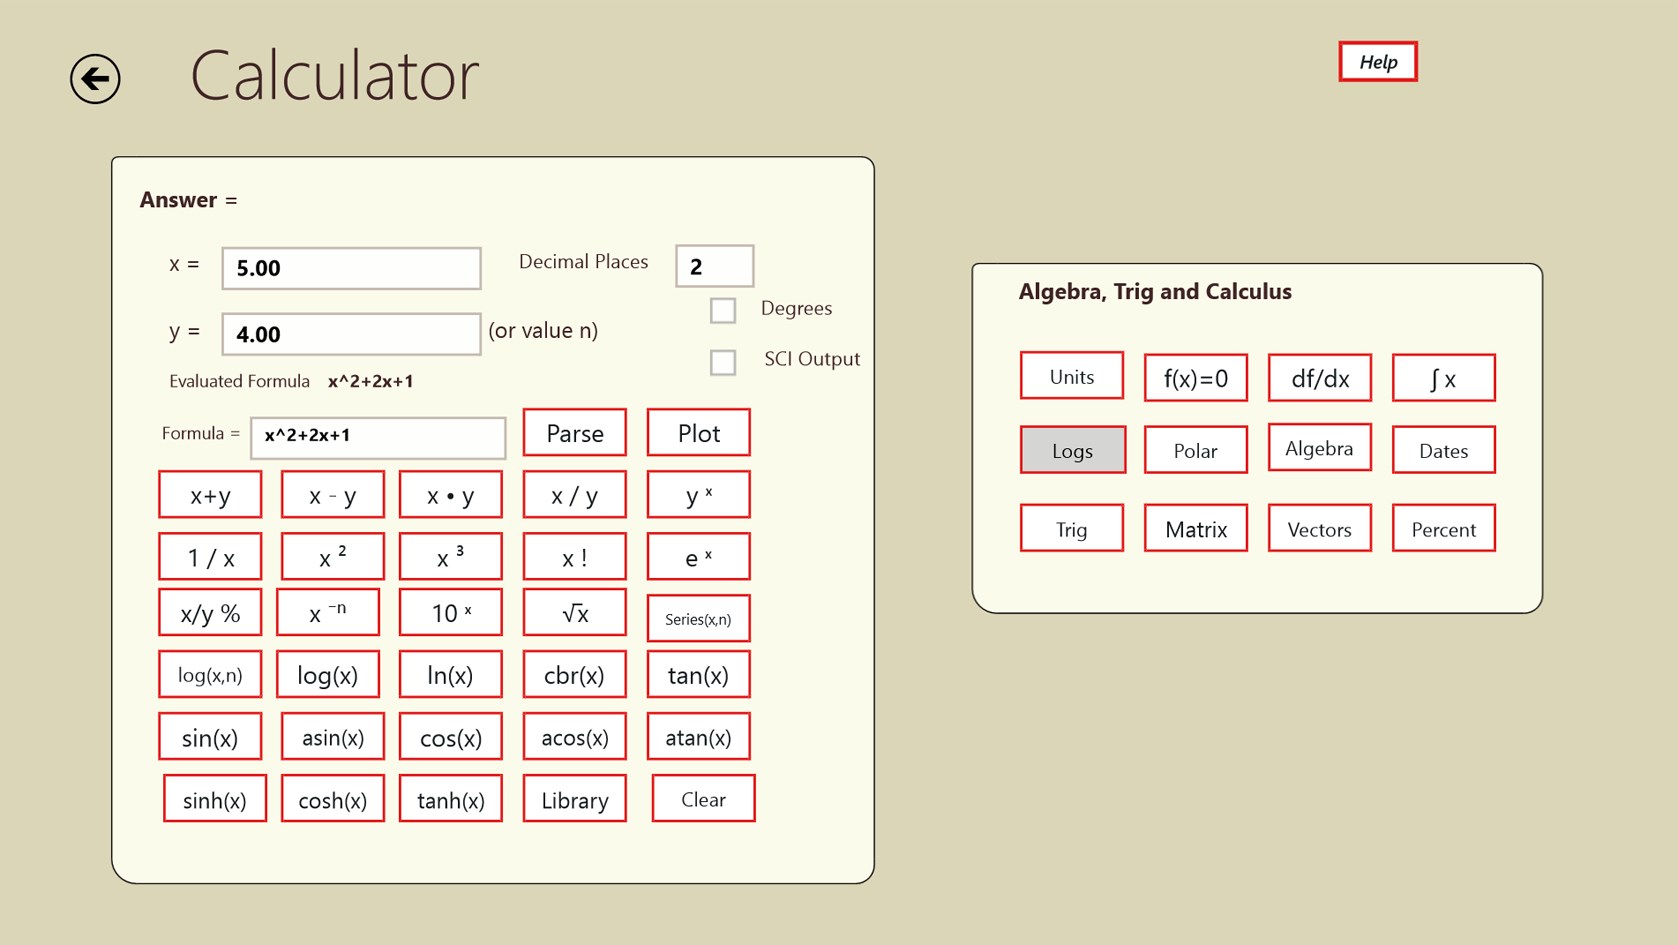
- Scientific Calculator covers College Algebra, Trigonometry, Geometry, Pre-Calculus, College Math and Calculus
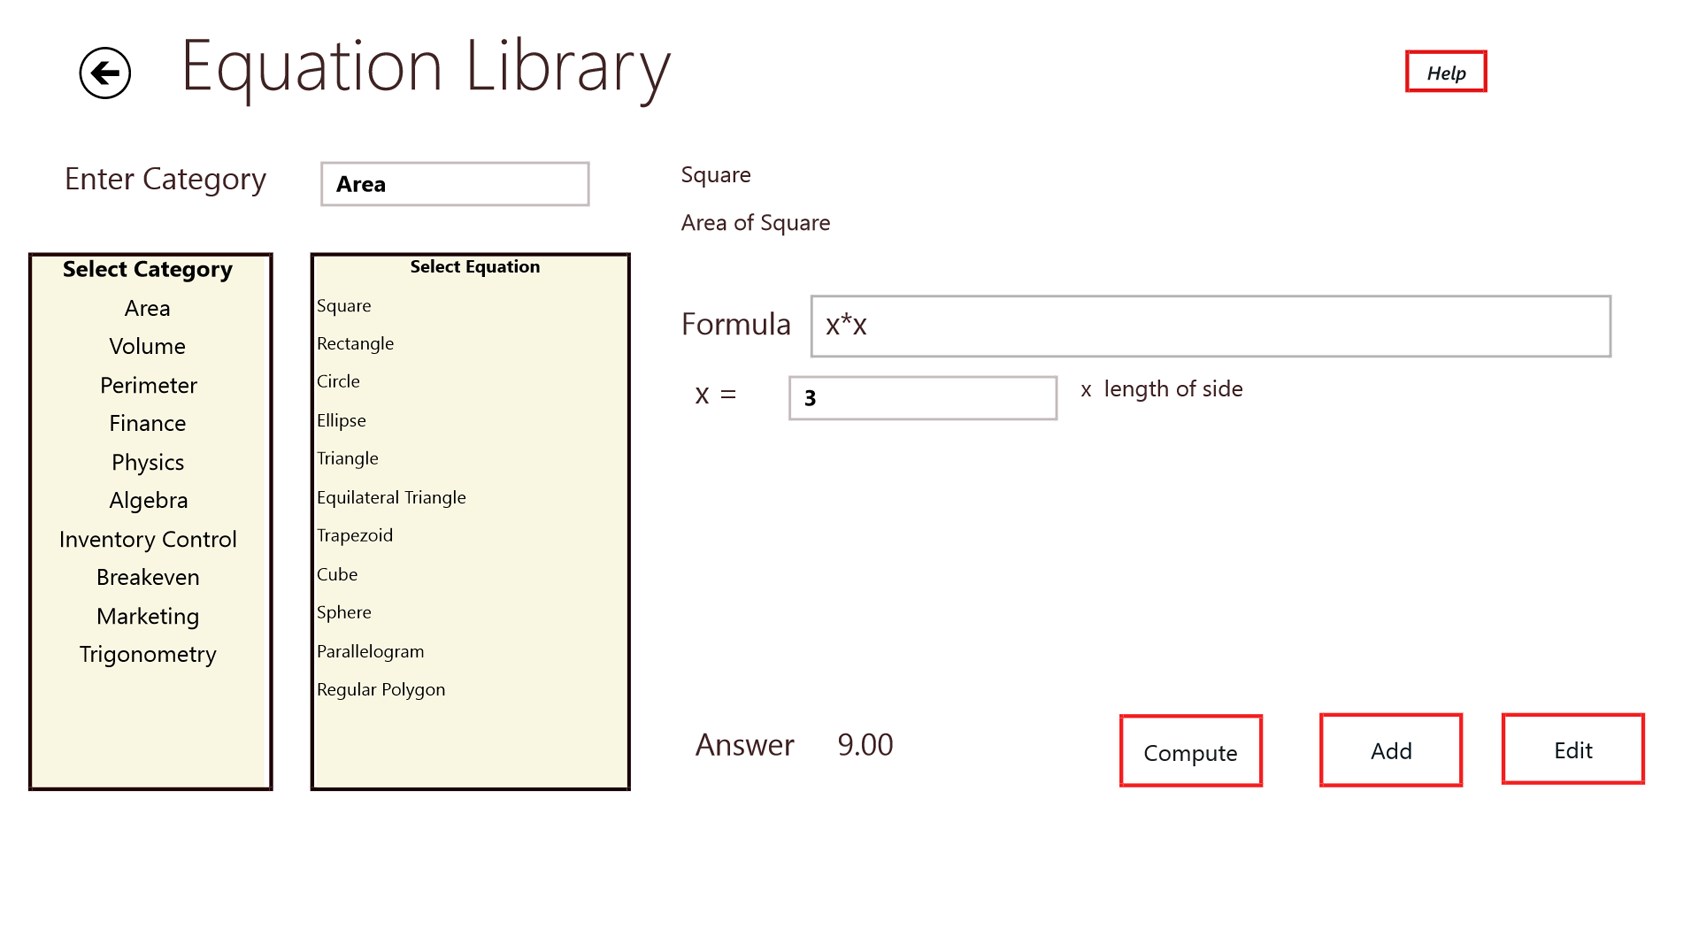
- An extensive equation library is included covering algebra, finance, geometry, physics, trig and business applications containing over 80 equations
- Example data is built in, intuitive and easy to use

Similar Apps View all


Comments
